
The first question we asked ourselves was ” Can we come up with an approach/system that is not being used or something that they wouldn’t develop by themselves with all their immense resources?”. Thus began our challenge in trying to define/develop a carbon labeling system or an approach that captures the real essence of carbon valuation in development of large infrastructure projects. Not everyday you would be challenged with a task that pits your wits against the best in the industry in the context of a course team project. That was specifically what I did when I was involved in a team project that was eventually presented to one of the top engineering and management consultancy as part of a project.
Why electricity?
As a team we had an option to pick any particular sector or provide a general approach to address the problem of ‘carbon labeling’ or what we internally call as ‘carbon valuation. We decided to pick up electricity sector in particular and look at address the missing links. But, Why?

The world is de-carbonising, we are shifting our dependency from fossil power to renewables. Also, in due course of time in addition to an increased energy demand because of growing population we will have more sectors that rely on energy like rail transportation or even electric mobility and hence it was imperative to choose electricity which we believe is moving from just another secondary energy source to what we call will be a future ‘common currency’.
Defining the problem and a boundary
After finalising the sector, it was necessary to define the actual problem within the current valuation schemes in the sector and fix a boundary for operation. It was crucial to account for the extraction of resources, project planning, construction and operation. For simplicity purpose decommissioning and distributed energy generation were kept out of the scope of ‘energy value chain’.
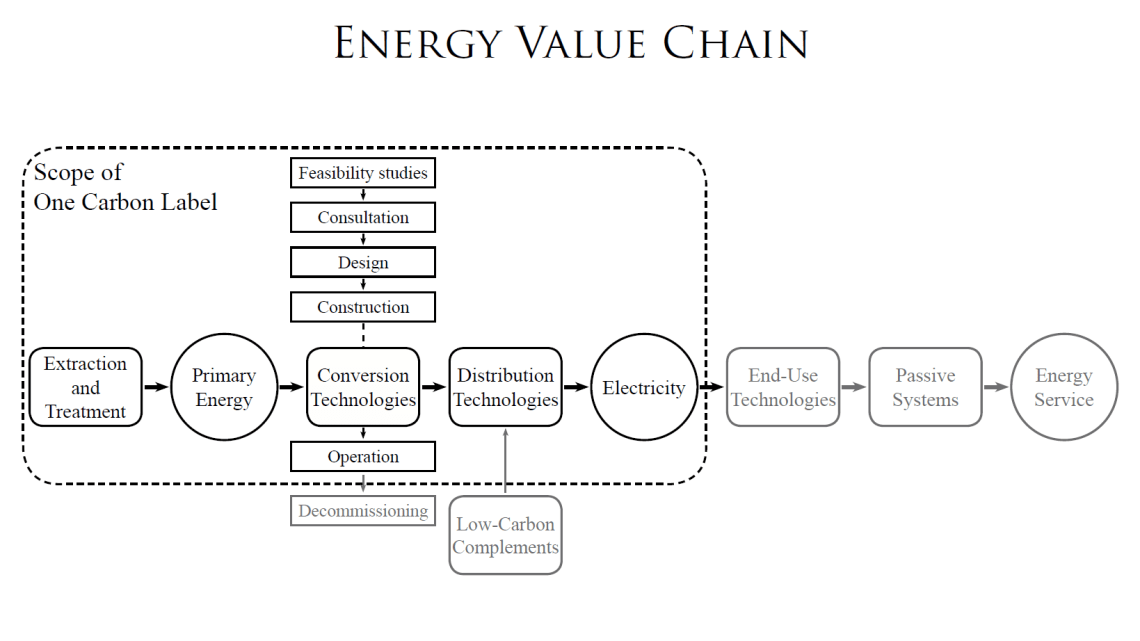

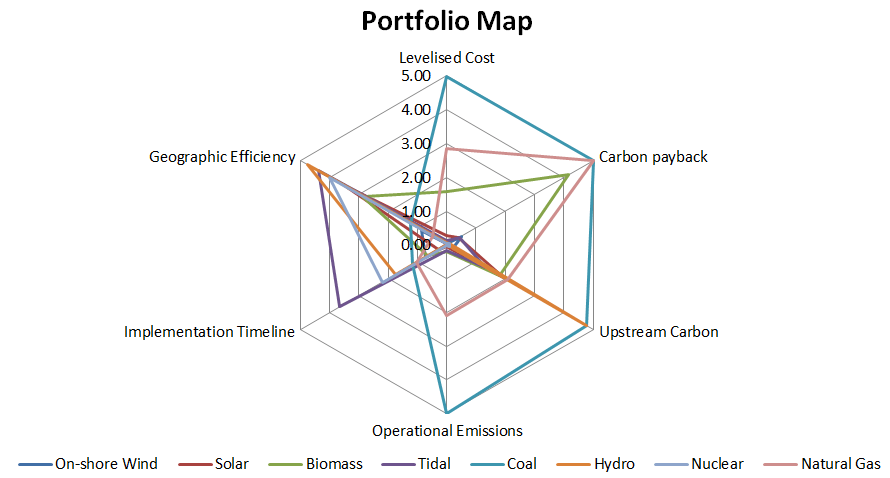
Even in the first few meetings, it was clear that there was a need to redefine the existing carbon labels or probably have a better representation and thus was born the concept of a ‘radar’ diagram.
The six metrics
Once the idea of a radar representation was finalised, the metrics had to be defined and after thoughtful consultation the six final metrics of evaluation turned out to be
- Levelised Cost : The idea behind this was to evaluate every project in terms of what commitment it offered in terms of CO2 mitigation per pound of price paid. The rationale was to compare the higher feed in tariffs/strike prices against the projected carbon mitigation possibility over an entire project lifetime covering up the initial construction and operational costs.
- Carbon payback: This metric was quite clear and had to be there among the rest. It indicated the time period required to recover the initial carbon that is invested in construction.
- Upstream Carbon: The amount of carbon equivalent that goes into construction of a power project. This figure is typically given in the life cycle assessment (LCA) calculation of any power project.
- Operational emissions: Not all technologies have a constant operational emission. Few technologies have more operational emissions compared to construction over a project lifetime.
- Geographic Efficiency: The unorthodox approach kicks in here. Why aren’t transmission and distribution inefficiencies accounted in terms of carbon? In terms of natural gas projects or off shore wind farms, something about the supply and distribution system is missed in carbon valuation of projects.
- Project Timeline: Large scale power infrastructure projects across the world never start and finish as predicted in the planning phase. Specifically in UK, we have some project classics that have been in the planning phase for too long to actually define what the eventual carbon offset is going to be. Herein comes our USP, project planning and timeline is crucial for defining the ‘Time value of Carbon‘.
In defining the six metrics it had to be ensured that these could be used in all power projects.
Projects and process
In order to evaluate the concept it was decided to test it on actual project cases. Since, we had six metrics and had to define a ‘One Carbon Label’ the idea was to run through eight different projects from different technologies and rank their carbon performance.
- The projects were careful chosen based on the availability of credible data from reliable sources to test in the metric.
- Projects within the UK would make it more attractive.
- An Analytical Hierarchy Process (AHP) was run through in order to weigh down the six metrics against each other and normalise them over a score of 100.
Key Insights from results
- As expected a renewable energy project ended up being high in the ranking. Although the sizewell B did well to come second, but the inherent issue with problem in the implementation timelines of a nuclear power plant was visible.
- A solar project does well too. But solar captures something more important in upstream carbon. Where are the panels being manufactured? If China, what is the grid emission factor in China that equates a carbon value. The DECC solar feasibility study clearly defines this crucial value.
- A high promising project like a Severn Tidal is pulled down just because of its over two decade of project planning.
- A hydro project is definitely renewable but it doesnt score well on the geographic efficiency and its massive construction carbon.
- And due to obvious reasons, a power plant run by natural gas and coal hit the extremes of the rating scales. Carbon Capture and Sequestration would have been considered if not for lack of reliable data.

The next big idea in the project was to put one score and a cool looking label. It was decided to rank the projects as A, B C just to stay in line with energy efficiency ratings and colour codes. The final scores defined the ‘One carbon labelling system’. The score were computed on AHP and colour coded accordingly. Onshore wind, nuclear, solar got a ‘a’, tidal, hydro and biomass a ‘b’, natural gas a ‘c’ and coal a ‘e’. These rankings and scores are particular to the specific projects under each technology and sector that was evaluated for the exercise and this by no means proclaims an uniform score for a particular technology at the current time.
The Launch
To an extent we expected a critical review of the system at launch. The method and system was presented to the senior management of the firm. We did face a few hard questions on the approach, because we did do a comprehensive work of evaluating the existing projects and putting a score which in our view was ‘realistic’. We did have to justify the use of six metrics which to an extent duplicates carbon valuation of the project, but the six metrics are intended to a wider audience who would favour one metric over the other. And the idea of having a one score from the six metrics was also challenged, but we believe it is essential to get an overall score that balances all the metrics. The big question as expected was ‘When and where do think this could be used?’. Well, when there is an opportunity to make policy suggestions to government by comparing different technological options and accounting cost and valuing carbon this tool could be used. It does more than an LCA and it is dynamic in context of time. The tool overall captures the various system dynamic interplay in an energy project, right from planning, material manufacturing and import to construction and operation. In conclusion, as we set out to do in the start if there was one theme or key information that the client could takeaway from our presentation and approach it would have to be the ‘Time value of Carbon’ and we were glad that they did acknowledge it as a key message from our presentation.
Special thanks to my team Rafael, Brendon, Tahawar, Martin and Alessandra for their contributions. Cover image © Alessandra.

1 Comment